Subscribe & get the latest news in your email

By
November 11, 2021

Although an electric vehicle (EV) does not cause direct carbon dioxide emissions when driving, every EV has non-neglectable upstream emissions of greenhouse gases (GHG) from power generation: The well-to-wheel emissions.
These emissions are becoming increasingly relevant for the world to reduce global GHG emissions. But what causes these emissions, and how can they be limited in the future?
The Vehicle Technologies Office of the US Department of Energy published a report that calculates the emissions of EVs in the US. The report estimates an average of 4,815 pounds (2184 kg) of CO2-equivalent emissions for a typical EV per year as compared to the average gasoline-powered car, which produces 11,435 pounds (5186 kg) of CO2-equivalent emissions annually. Consequently, when using an electric vehicle, a driver reduces his CO2 footprint on average by around 60%.
Why is an EV producing emissions equal to a roundtrip flight from San Francisco to New York?
To answer this question, we need to look at the electric energy production. Like most modern countries, the US utilizes a mix of various energy resources. The graph below shows the current US energy production divided into power sources. According to it, more than 50% of the electric energy in the public grid is generated by non-renewable energy resources. As vehicles are mostly charging electric power from the grid, it explains why we produce CO2 emissions when driving EVs.

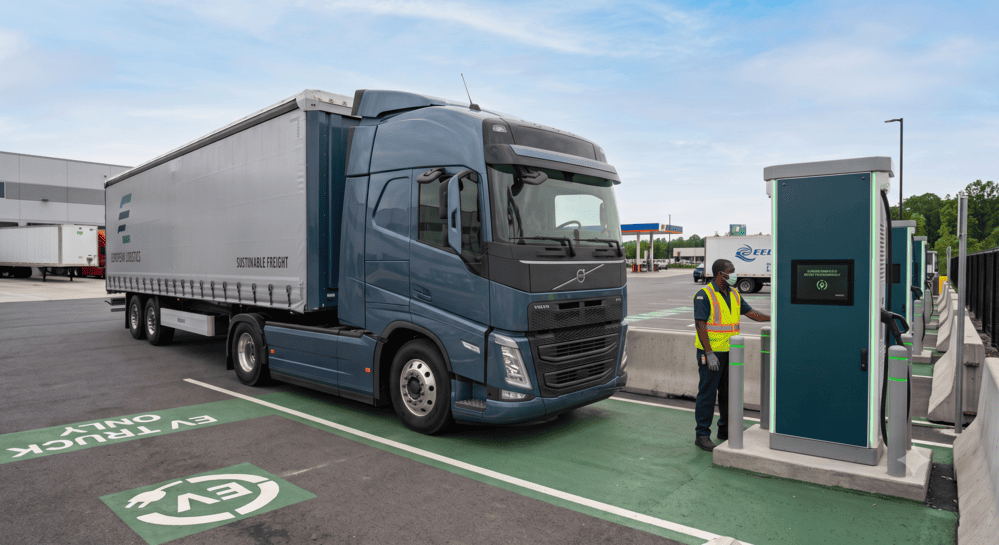
To understand better how managed charging (Smart Charging) of electric vehicles can influence the total CO2 emissions, we need to examine the charging habits of EV users. An excellent way to analyze this is by looking at electric fleet vehicles.
Every time a driver plugs in his car is described as a charging event. Each charging event has a stay-time (how long is a vehicle plugged-in) and a charging volume (how many kWh does the car require). In the example below (graph), we identified three groups of charging events:

This observation provides us the information that more than 50% of the vehicles stay quite long at the charging station while the cars only require a little amount of energy (less than 20 kWh). This effect indicates high flexibility, meaning that the charging event can start later or can be processed with less power. High flexibility is ideal for Smart Charging, as the algorithms identify this potential and optimize the start of these charging events. For instance, by matching the charging events to renewable energy resources.
Next, we need to understand why EV charging flexibility in combination with the energy mix is essential to reduce the vehicle’s CO2 emissions.
For this purpose, we have analyzed energy mix data provided by the NYISO, the New York Independent System Operator. In New York, the biggest electric energy providers are dual fuel (mix of gas and oil) and Nuclear. The most significant renewable energy resource is hydropower.
As the energy plants don’t produce the same energy amount at any point of the day, the amount of renewable energy in the electric grid varies during the day. The following graph shows an example for November 26th, 2019.

We can see that each energy resource has its peak production. For instance, around 5 PM, more than 30% of the energy is produced through dual-fuel, while at around 4 AM, this value drops to less than 20%. One major influence factor for the volatility of this is the continual change of the weather and season.
As this is only a very rough indication, we can go even further and look at the question of how each energy source causes CO2 emissions.Luckily, The Intergovernmental Panel on Climate Change (IPCC) has calculated greenhouse gases emitted in its entire life cycle for various energy resources. This, also called measurement of life-cycle greenhouse gas emissions, involves calculating the global-warming potential of electrical energy sources through a life-cycle assessment of each energy source. The following table shows significant examples of CO2 emissions in kWh produced electric energy.

At amcontrol.io, we have taken these results and calculated normalized CO2 emissions for an entire day, using the previous example of New York (NYISO). The following graph shows a peak at around 4 PM and the lowest CO2 emissions between 10 PM and 5 AM.

This new perspective shows that Smart Charging can reduce the well-to-wheel emissions of electric vehicles. In the presented example, we can achieve an approximate CO2 reduction of 30-40 % when charging after 11 PM. This is close to one flight to one flight from New York to San Fransisco.
Consequently, we can summarize that:
The good news is that the US has been very active in the past year redefining their Renewable Portfolio Standards (RPS), which require that a specified percentage of the electricity that utilities sell comes from renewable resources (Examples: New York: 100% by 2040; Vermont: 75% by 2032; California: 100% by 2045).
Ampcontrol is a cloud-based software that seamlessly connects to charging networks, vehicles, fleet systems, and other software systems. No hardware needed, just a one-time integration.