
Gewinnschwelle und kumulierte Einsparungen für Ihre Elektroflotte
Erfahren Sie genau, wann sich Ihre Investition in ein Elektrofahrzeug auszahlt — und wie viel Sie danach verdienen. Wir modellieren Ihre kumulative Sparkurve Jahr für Jahr, sodass Sie jedes Haushaltsgespräch mit einem klaren finanziellen Zeitplan beginnen können.
Finden Sie das genaue Jahr heraus, in dem Ihre EV-Flotte Gewinne erzielt
Das Break-Even-Jahr ist die einzige Zahl, die sich die meisten Finanzteams als Erstes wünschen. Es ist der Punkt, an dem die kumulierten Einsparungen beim Betrieb von Elektrofahrzeugen die Anfangsinvestitionen in Fahrzeuge und Infrastruktur übersteigen. Bei den meisten unserer Flotten findet dieser Übergang zwischen dem dritten und dem fünften Jahr statt. Der genaue Zeitpunkt hängt jedoch von Ihrem Arbeitszyklus, den lokalen Energiepreisen, den verfügbaren Anreizen und der Staffelung Ihrer Infrastruktur ab. Wir modellieren dies präzise für Ihre Flotte, damit Sie Ihrem CFO und Ihrem Vorstand eine glaubwürdige, vertretbare Zahl vorlegen können.
- Break-Even-Jahr, berechnet auf abgezinster und nicht abgezinster Basis
- Sensitivitätsanalyse, die zeigt, wie sich die Gewinnschwelle bei unterschiedlichen Brennstoffpreis- und Energietarifannahmen verändert
- Visuelle kumulative Sparkurve von Jahr 1 bis Jahr 10

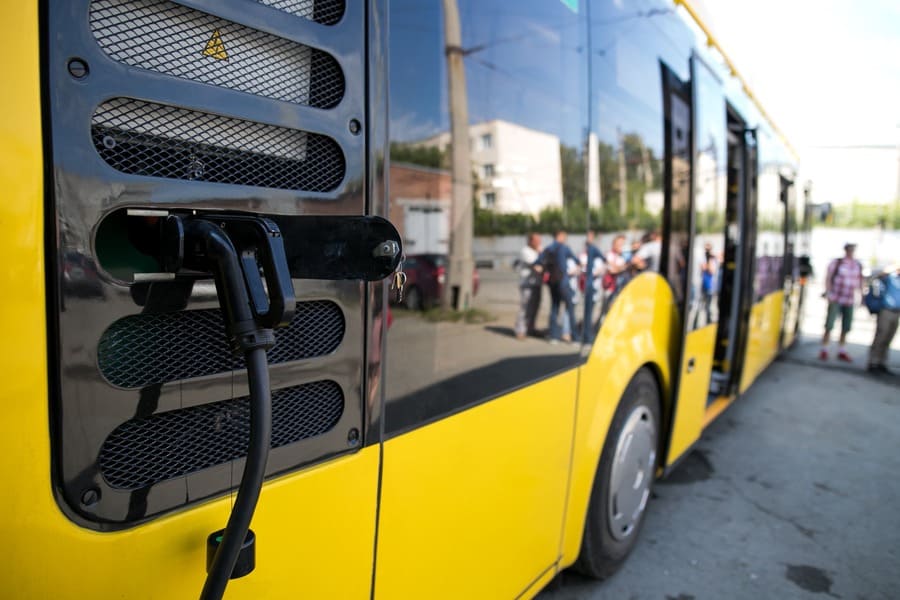
Branchenübergreifend
.png)


.png)
.png)

Jedes Jahr nach der Gewinnschwelle werden aufsummierte Renditen erzielt
Sobald Ihre Flotte die Gewinnschwelle erreicht hat, sammeln sich die Einsparungen schnell an. Niedrigere Kraftstoffkosten, geringere Wartungskosten und die Vermeidung von Kosten für die Einhaltung der CO2-Emissionen führen zusammen zu erheblichen jährlichen Cashflow-Vorteilen gegenüber dem kontinuierlichen Betrieb von Fahrzeugen mit Verbrennungsmotor. Bei einer Flotte von 30 bis 50 Fahrzeugen liegen die jährlichen Einsparungen nach der Gewinnschwelle je nach Fahrzeugklasse und Betriebszyklus in der Regel zwischen 500.000€ und 2 Mio. €. Wir modellieren dies Jahr für Jahr, sodass Sie nicht nur sehen können, wann Sie die Gewinnschwelle erreichen, sondern auch, wie viel Sie in den Jahren 5, 7 und 10 verdienen.
- Aufschlüsselung der Ersparnisse nach der Gewinnschwelle von Jahr zu Jahr
- Kumulativer 10-Jahres-Wert im Vergleich zur Fortführung der ICE-Flotte
- Spanne der jährlichen Einsparungen nach der Gewinnschwelle nach Fahrzeugklasse und Flottengröße
.png)
Führen Sie Ihren Rollout in Phasen durch, um schneller die Gewinnschwelle zu erreichen
Die Reihenfolge Ihrer Elektrifizierungsmaßnahmen hat einen erheblichen Einfluss darauf, wann Sie die Gewinnschwelle erreichen. Die Priorisierung von Fahrzeugen mit hoher Auslastung, Strecken mit hoher Kilometerleistung und Standorten mit hoher Netzverfügbarkeit beschleunigt Ihre Sparkurve, ohne die Gesamtinvestitionen zu erhöhen. Wir modellieren phasenweise Bereitstellungsszenarien — in der Regel über einen Zeitraum von 3 bis 5 Jahren — und zeigen, wie sich jede Phase auf Ihren kumulativen Sparzeitplan auswirkt, sodass Sie eine strategische Entscheidung über die Kapitalallokation treffen können, anstatt eine Alles-oder-Nichts-Verpflichtung einzugehen.
- Schrittweise Bereitstellungsszenarien, modelliert über einen Zeitraum von 3 bis 5 Jahren
- Auswirkungen der Fahrzeugpriorisierung auf das Break-Even-Timing
- Optionen für die Kapitalallokation: komplette Flotte oder Ansatz, bei dem hohe Renditen an erster Stelle stehen
.png)
Optimiertes Laden für Schulflotten in ganz Nordamerika
First Student maximiert Energieeinsparungen und die Verfügbarkeit von Ladegeräten für Schulen in ganz Nordamerika

WatteV erzielt betriebliche Exzellenz für Ladestationen für Elektrofahrzeuge
WatteV verwendet die Software von Ampcontrol, um den gesamten Spitzenstrombedarf zu reduzieren und eine hohe Verfügbarkeit der Ladeinfrastruktur für die Flotten sicherzustellen.

Revel nutzt KI-gestützte Lösungen, um die Flotteneffizienz zu steigern
Revel verwendet die Software von Ampcontrol, um die Kraftstoffkosten zu senken und den Zugang zu öffentlichen Ladestationen zu ermöglichen.

Wie Takealot und Aeversa die Energiekosten für Elektroflotten um bis zu 65% senken
Erfahren Sie, wie Takealot und Aeversa die Energiekosten für Elektroflotten um bis zu 65% senken.

Die Plattform von Geotab wurde um intelligente Ladelösungen für Elektrofahrzeuge erweitert
Geotab Marketplace ist wegweisend für die Verbindung von Flotten-Telematik und intelligentem Laden

Automatisches Lastmanagement für Elektrofahrzeuge mit KI-Unterstützung von Electrada
Erfahren Sie in dieser Fallstudie, wie Electrada ein KI-gestütztes automatisches Lademanagementsystem für Elektrofahrzeuge einsetzt, um die Betriebskosten für ihre Flotten und Kunden zu senken.

7Gen bietet KI-gestütztes Lademanagement für schlüsselfertige Lösungen
7Gen elektrifiziert kanadische EV-Flotten mit der Ampcontrol Lademanagement-Software

Aeversa überwindet die Netzkapazität mithilfe von Lastmanagement-Software
Aeversa verwendet Ampcontrol für den Energiefluss und die Überwachung der Ladebetriebszeit von Elektroflottendepots in Südafrika.
Bringen Sie Ihren Betrieb mit Ampcontrol auf die Sprungkraft


Optimieren Sie den Betrieb Ihrer Elektroflotte


FAQs
Bei den meisten kommerziellen Flotten, die wir bewerten, liegt die Gewinnschwelle zwischen dem dritten und dem fünften Jahr ab Beginn des Flotteneinsatzes. Der genaue Zeitpunkt hängt von vier Hauptfaktoren ab: den lokalen Diesel- und Strompreisen, den Vorabkosten für Fahrzeuge und Infrastruktur abzüglich der Anreize, der täglichen Kilometerleistung und Auslastung der Flotte sowie der Verfügbarkeit von Anreizen auf Bundes-, Landes- oder Versorgungsseite. Flotten mit hohem Kilometerstand in Regionen mit starken Anreizprogrammen und hohen Dieselpreisen erreichen in der Regel kurz vor dem dritten Jahr die Gewinnschwelle. Flotten mit geringerer Auslastung oder Standorte mit erheblichen Kosten für den Netzausbau könnten dem 5. oder 6. Jahr näher kommen.
Die kumulierten Einsparungen werden als laufende Summe der jährlichen Kostendifferenz zwischen dem Betrieb Ihrer Elektrofahrzeugflotte und dem weiteren Betrieb der entsprechenden Verbrennungsflotte berechnet. Zu den jährlichen Einsparungen gehören niedrigere Energiekosten im Vergleich zum Kraftstoff, geringere Wartungskosten, die Vermeidung von Kosten für die Einhaltung der CO2-Emissionen und alle laufenden Anreize für Versorgungsunternehmen oder Preissenkungen durch intelligentes Laden. Wir ziehen die amortisierten Kapitalkosten für Fahrzeuge und Infrastruktur von den jährlichen Einsparungen ab, um einen Nettowert zu erhalten, der im Break-Even-Jahr positiv wird und danach weiter wächst.
Ja, deutlich. Eine schrittweise Einführung bedeutet, dass sich Ihre Kapitalinvestition über mehrere Jahre verteilt, was Ihre anfängliche Amortisationslast reduziert und Ihr Break-Even-Datum sogar vorziehen kann, wenn Sie zuerst die Fahrzeuge mit der höchsten Rendite priorisieren. Wenn Sie beispielsweise Ihre 20 Lkw mit der höchsten Kilometerleistung im ersten Jahr einsetzen und in den Jahren zwei und drei Fahrzeuge mit geringerer Auslastung hinzufügen, wird die Gewinnschwelle auf Flottenebene häufig schneller erreicht, als wenn Sie alle Fahrzeuge gleichzeitig einsetzen. Wir modellieren Szenarien mit mehreren Phasen, sodass Sie die finanziellen Auswirkungen verschiedener Sequenzierungsstrategien erkennen können.
Nach Erreichen der Gewinnschwelle führt jedes Jahr des Betriebs der Elektrofahrzeugflotte zu Nettoeinsparungen im Vergleich zur Verbrennungsalternative — und diese Einsparungen steigen im Laufe der Zeit, da die Dieselpreise steigen und die Betriebskosten für Elektrofahrzeuge relativ stabil bleiben. Bei einer mittelgroßen Flotte von 30 bis 50 Fahrzeugen liegen die jährlichen Einsparungen nach der Gewinnschwelle je nach Fahrzeugklasse, Kilometerstand und lokalen Energiepreisen in der Regel zwischen 500.000€ und 2 Mio. €. Über einen Zeitraum von 10 Jahren machen die kumulierten Einsparungen in den Jahren 5 bis 10 häufig das Drei- bis Vierfache der gesamten Kapitalinvestitionen der Jahre 1 und 2 aus.
Die Verschlechterung der Batterie wirkt sich im Laufe der Zeit sowohl auf die Reichweite des Fahrzeugs als auch auf den Restwert aus. Unser Modell berücksichtigt bei handelsüblichen EV-Batterien einen typischen jährlichen Kapazitätsabbau von 2— 3%, was in späteren Jahren, da die Reichweite leicht abnimmt, zu einem moderaten Anstieg der Energiekosten pro Meile führt. Am Ende des Analysezeitraums gehen wir außerdem von einer konservativen Restwertannahme für EV-Batterien aus. Wenn ein Wert für die Lebensdauer einer Batterie relevant ist — zum Beispiel, wenn Batterien für stationäre Speicher wiederverwendet werden —, können wir diesen Wert als zusätzlichen Wertstrom in das Modell einbeziehen.
Ja, und so strukturieren wir eigentlich jede Analyse. Das Basisszenario sind immer die Kosten für den weiteren Betrieb Ihrer aktuellen Verbrennungsflotte — einschließlich der prognostizierten Kraftstoffkostenerhöhungen, der laufenden Wartung und der steigenden Kosten für die Einhaltung der CO2-Emissionen gemäß den geltenden Vorschriften. Das EV-Szenario wird dann Jahr für Jahr mit diesem Basiswert verglichen. Das bedeutet, dass die Gewinnschwelle und die kumulierten Sparzahlen immer im Verhältnis zu einer realistischen Alternative, bei der nichts unternommen wird, ausgedrückt werden, und nicht im Verhältnis zu einem willkürlichen Benchmark.